
In this blog, we’ll look into how strace command in Linux works, a real-world debugging example, and why it’s not recommended in production due to performance overhead.
Troubleshooting is important to every DevOps engineer's or SRE's job.
It could involve:
- Database performance bottlenecks
- Web server performance issues
- Identifying slow requests
- Excessive resource consumption
and more…
The strace utility is useful for debugging various application issues by tracing system calls (syscalls).
Note: If you want to understand about syscalls, please read the syscalls guide.
This edition is for educational purposes only. Do not use strace in production without understanding its effects on performance.
Scenario
Let’s say the Nginx app wants to write a log entry to a file on the disk. Since Nginx cannot directly access hardware like disks, it must use syscalls to request kernel services.
For example, Nginx might use the following syscalls:
open()– Opens log files once when Nginx starts - (not per write)write()– Writes the log entries to the file in buffered batches.close()– Closes the file descriptors during log rotation/shutdown
That means Nginx is programmed to use syscalls whenever it needs to interact with the operating system for tasks like file operations, network handling, or process management.
If you need to diagnose an issue related to an application's performance, networking, or other system interactions, tracing syscalls can help you identify the problem.
What is strace?
Strace is a Linux command-line utility that intercepts and records all the system calls a program (e.g, nginx) makes and any signals it receives.
Let's look at a simple example.
Let's look at a summary of system calls made when running the ls command.
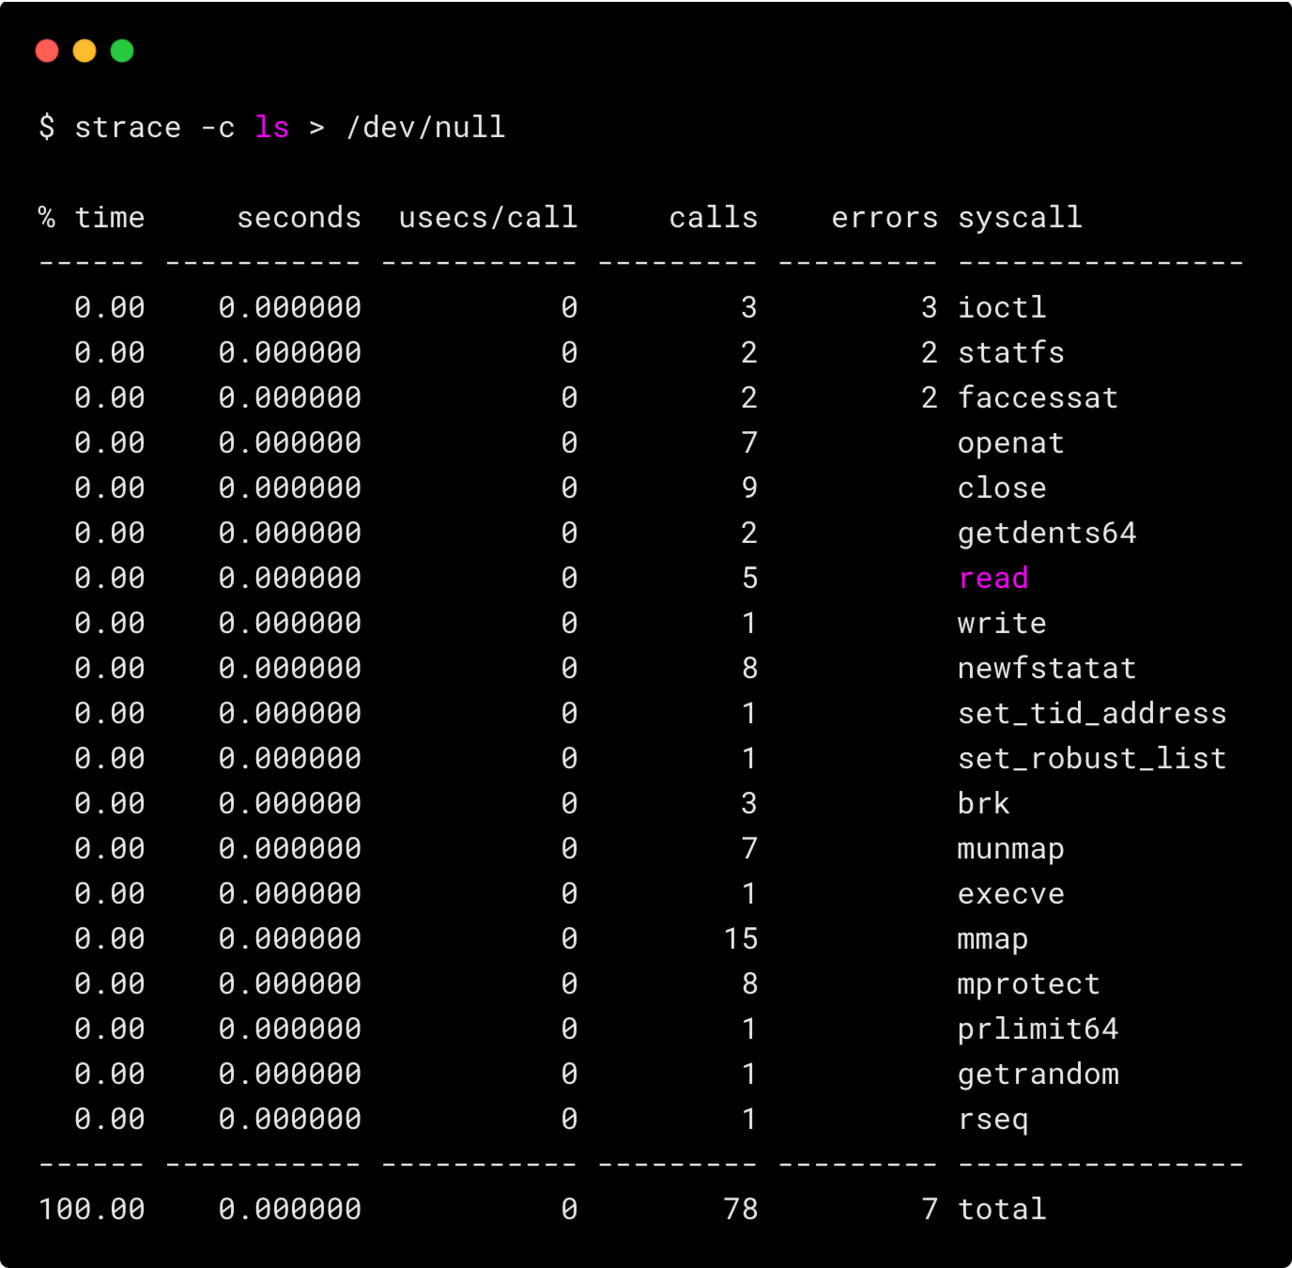
Overall, the command made 78 system calls with 7 errors total.
Also, the execution time was extremely fast (all individual calls show 0.000000 seconds)
Practical Debugging Example
To look at a practical debugging example using strace, I had to simulate a real-world scenario of a slow-responding page.
To simulate this scenario, here’s what I did:
- Deployed Nginx with PHP-FPM.
- Created a simple PHP page (
/slow) that responds only after 2 seconds. This is just to simulate a real-world scenario of a slow response page.
The next step is to capture the syscalls made by Apache when accessing the http://localhost/slow page.
Tracing nginx syscalls
We first need to get the Nginx worker process ID to trace the syscalls.
ps aux | grep nginxNow, we need to attach strace to the process ID to trace system calls.
Since we are investigating a slow-responding page, our focus should be on the syscalls involved in handling HTTP requests and responses.
I am going to trace only the recvfrom() syscall using the following command. Here, 13173 is the Nginx worker process ID.
sudo strace -e trace=recvfrom \
        -p 13173 -f -T -tt -o strace.log
Now that strace is tracing the calls, I generated 10 requests with 2 concurrent users to capture the logs in strace.log using Apache Benchmark utility
ab -n 10 -c 2 http://localhost/slowNow that enough requests have been generated, the goal is to debug the slow response issue.
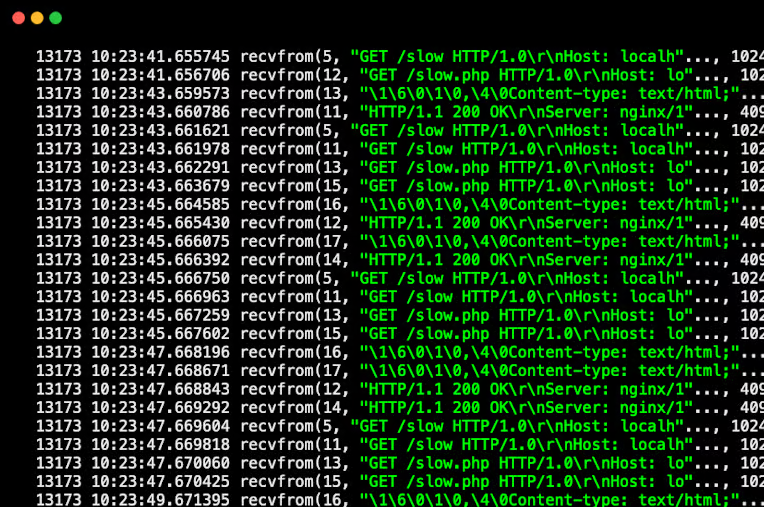
If we check the strace.log, we will find complex log entries containing recvfrom syscalls, similar to the following.
Analysis of recvfrom() Log for Slow Requests
Let's look at the first two entries.
13173 10:23:41.655745 recvfrom(5, "GET /slow HTTP/1.0\r\nHost: localh"..., 1024, 0, NULL, NULL) = 81 <0.000011>

13173 10:23:41.656706 recvfrom(12, "GET /slow.php HTTP/1.0\r\nHost: lo"..., 1024, 0, NULL, NULL) = 104 <0.000005>
Here,
- Client requests
/slow. - Nginx forwards it to
/slow.phpfor processing. - Time: 10:23:41.656706.
The next log entry is the response from php.
13173 10:23:43.659573 recvfrom(13, "\1\6\0\1\0,\4\0Content-type: text/html;"..., 4096, 0, NULL, NULL) = 72 <0.000041>Here,
- Response received from PHP after 2 seconds (10:23:43.659573).
- Delay: 2.003 seconds.
- This suggests slow PHP execution (Which we simulated)
Note: This is just an example of identifying slowness in an HTTP request. Depending on the issue, the relevant syscalls and the approach to analysis may vary.
Strace & Performance
Strace is not advised to be used in production environments.
One of the problems with strace is that it slows down applications significantly, especially in production.
It uses ptrace(), which pauses the target process twice per system call (entry and exit). It could even lead to application crashes.
This frequent pausing and context-switching adds high overhead to applications.
One of the safe alternatives to strace is sysdig
You can read more about it from Brendan Gregg's Blog
Conclusion
This is just an example to show how to use strace to debug system calls. In real-world scenarios, the syscalls and issues you debug will be different.
Also, strace-related questions are common in interviews for product companies or roles that require Linux knowledge.
Hope this blog was helpful.
If you have any doubts about this blog, drop it on the comment!